Basic information on mobility in the city
How many journeys are made on foot every day in the city? And by bicycle? Do women and men get around differently? How many people were seriously injured in traffic accidents last year? How many motorbike parking spaces are there in the city?
Periodically, data are compiled on the types of journeys undertaken by city residents, the distribution of public space, and road traffic accidents, among many other aspects. The aim is to gather and analyse information on the way we get around the city and the effects our journeys have so as to plan new measures and assess the impact of policies in place.
These data come from a number of different sources. They may come from municipal technical services, the Guàrdia Urbana city police, the results of the working day mobility survey (EMEF), public transport passenger information offered by the ATM, or TMB ticket use data.
>It should be noted that, in most cases, the values for the current and previous years are provisional estimates that are updated as additional data are collected.
Here's the information you can access:
Journey stages
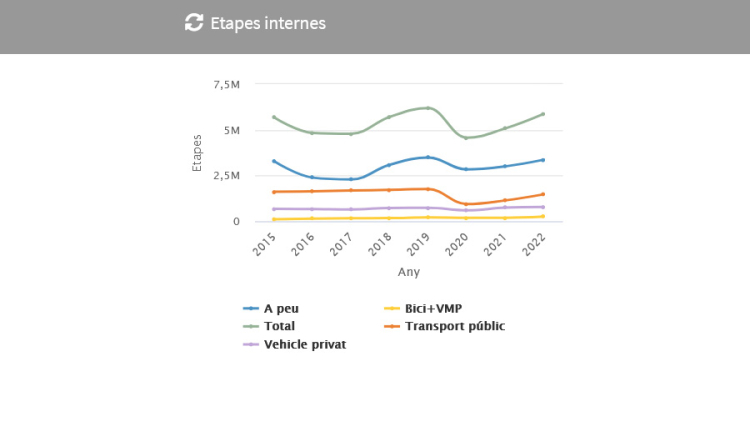
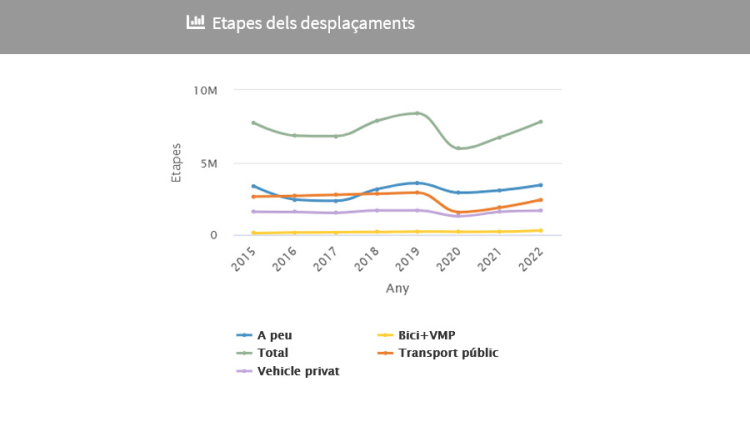
A journey can be made up of one or several stages, which can be covered by different means of transport. For example, a stage by train followed by metro, a bus ride followed by a bike ride, or perhaps a stage of walking to get to a mode of public transport.
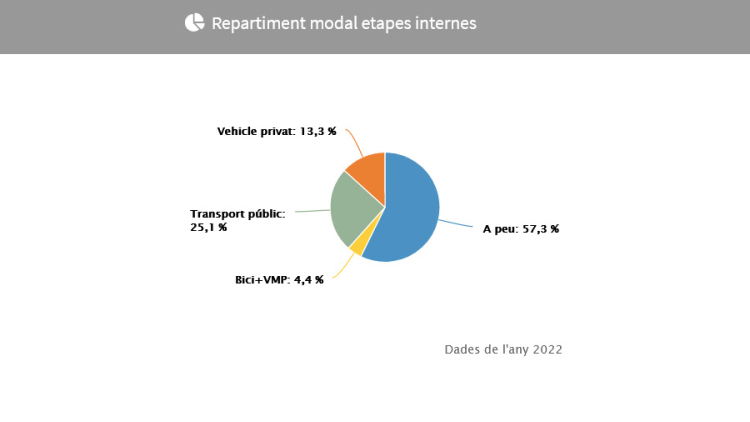
To present the data, the distribution of modes of transport is calculated by stages rather than journeys in order to reflect multi-modality, or the use of different modes of transport to undertake a single journey.
These data sets provide an estimation of the number of journey stages undertaken daily using each mode of transport in the city of Barcelona, both for journeys within the city itself and those that start or end outside the city. The data is also presented by gender.
Distribution of public space
These data sets show the distribution of public space for mobility. Pedestrian spaces are pavements and single-level streets where pedestrians have priority, bicycle spaces are cycle lanes and public transport spaces are bus lanes and tram platforms. Service cordons and reserved parking or loading and unloading spaces are also counted, and the rest of the roadway is made up of general traffic lanes.
Parks and green spaces are not included. You can also see specific results for each of the districts.
Accidents and road safety
The most relevant data on the number of accidents in the city, the vehicles involved and the seriousness of the accidents.
Mobility on foot/pedestrians
Data on the number of journey stages undertaken on foot in everyday mobility in Barcelona and gender differences in this regard.
Mobility by bicycle and PMVs
Data on the number of journey stages undertaken by bicycle and personal mobility vehicles (PMVs) and gender differences in this regard.
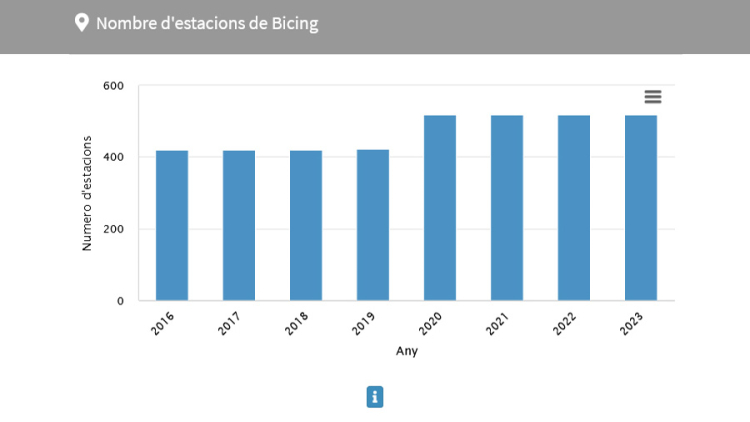
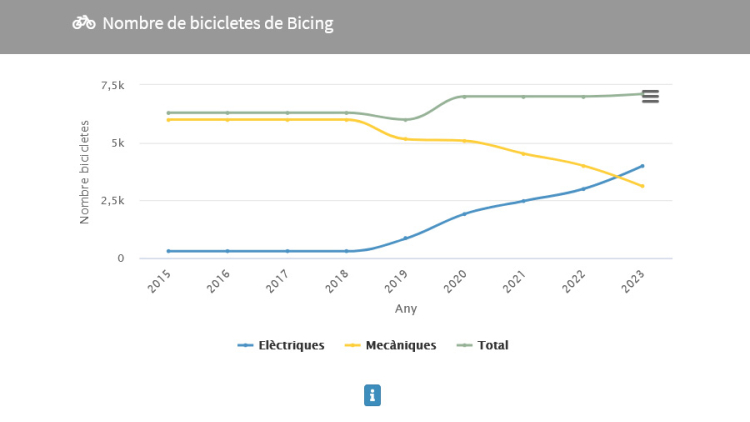
This category also includes data on kilometres in the cycle lane network, the use of these lanes and data on the use of Bicing.
Mobility by public transport
Data on the number of journey stages carried out by public transport. This category includes data on the length of lanes and also monthly journeys and ticket use for bus, metro and train.
Mobility by private vehicle
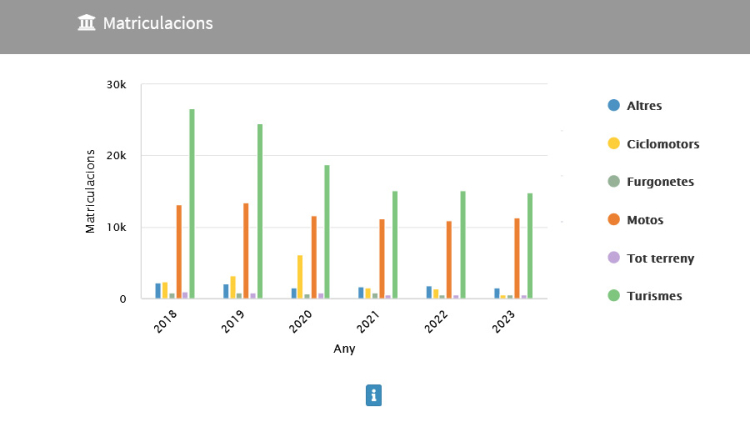
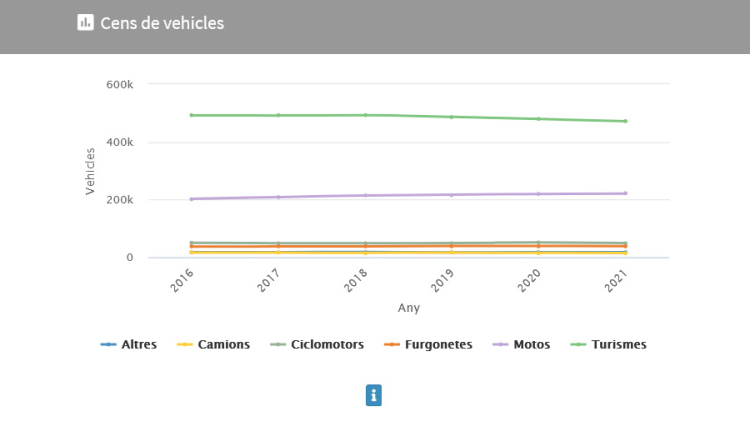
Data on the number of journey stages carried out using private motorised vehicles, broken down by gender. This category shows average daily traffic intensity on working days at different points on the road network. It also includes data on the vehicle fleet and vehicle registrations in the city, parking places, including loading and unloading spaces, and information on the evolution of electric vehicles.


